
Introduction
COVID-19 outbreak happend at the end of 2019 and quickly come a global threat to human-beings. I’ve seen many major internet companies, such as Tencent, Baidu, Alibaba, start to provide daily situation update. I personally also check the news and numbers everyday, so it’s very interesting for me to build another view of the monitoring using my favorite tool - shiny to visualize it.
Data
My initial thought was to crawl the data from the web, but the format the data was evolving so quickly for me to maintain a efficient python crawler to complete the job. Then I found there’s reliable data source from Johns Hopkins University, and there’s also a dashboard built by them as well.
ShinyApp
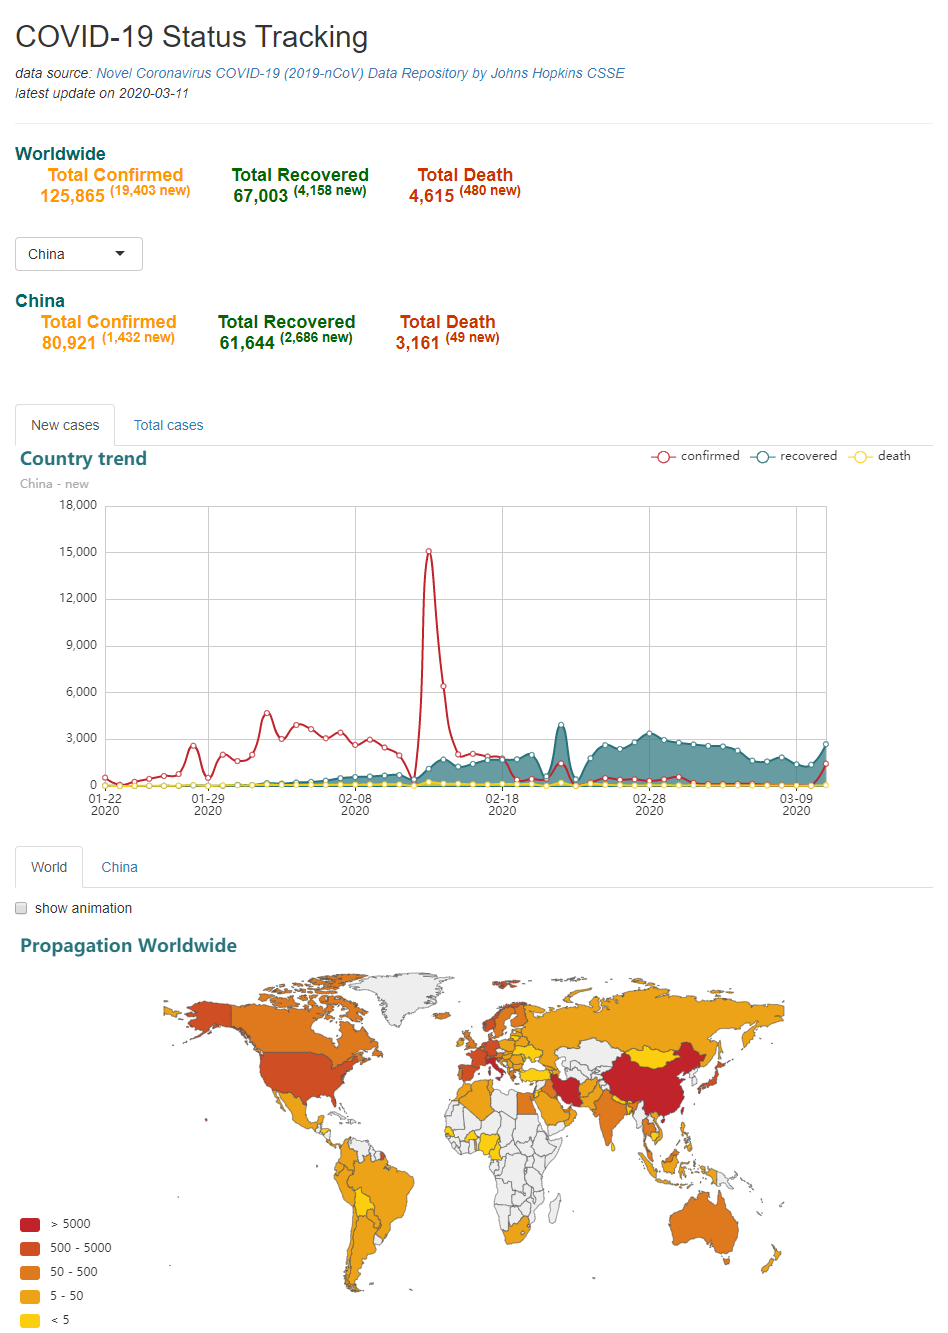 the demo is available here